Monitor Confluent Kafka
Introduction
Confluent Kafka comes with two offerings: Confluent Cloud and Confluent Platform.
Confluent Cloud is a fully managed, cloud-native service that provides Apache Kafka as a service, enabling organizations to easily stream data in real-time without the need to manage the complexity of self-hosting and maintaining Kafka clusters. Confluent Cloud offers a fully managed, scalable, and highly available event streaming platform that handles the operational overhead of Kafka, allowing you to focus on building applications with real-time data pipelines.
Some of the key components of Confluent Cloud include:
- Kafka Clusters
- Kafka Connect
- Confluent Schema Registry
- KSQL (Kafka SQL)
- Stream Processing
- Confluent Control Center
Confluent Platform is a self-managed distribution of Apache Kafka that offers enhanced features and APIs beyond the open-source version. Organizations can deploy and maintain Confluent Platform on their own infrastructure, giving them complete control over their environment. Since it builds upon Apache Kafka's core capabilities, Confluent Platform supports all Kafka use cases.
Steps to Follow
This guide follows these primary steps:
- Confluent Platform Setup
- OpenTelemetry Java Agent Installation
- Java Producer-Consumer App Setup
- OpenTelemetry Collector Setup
- Visualize data in SigNoz
Step 1: Confluent Platform Setup
1.1 Confluent Self-Managed Setup
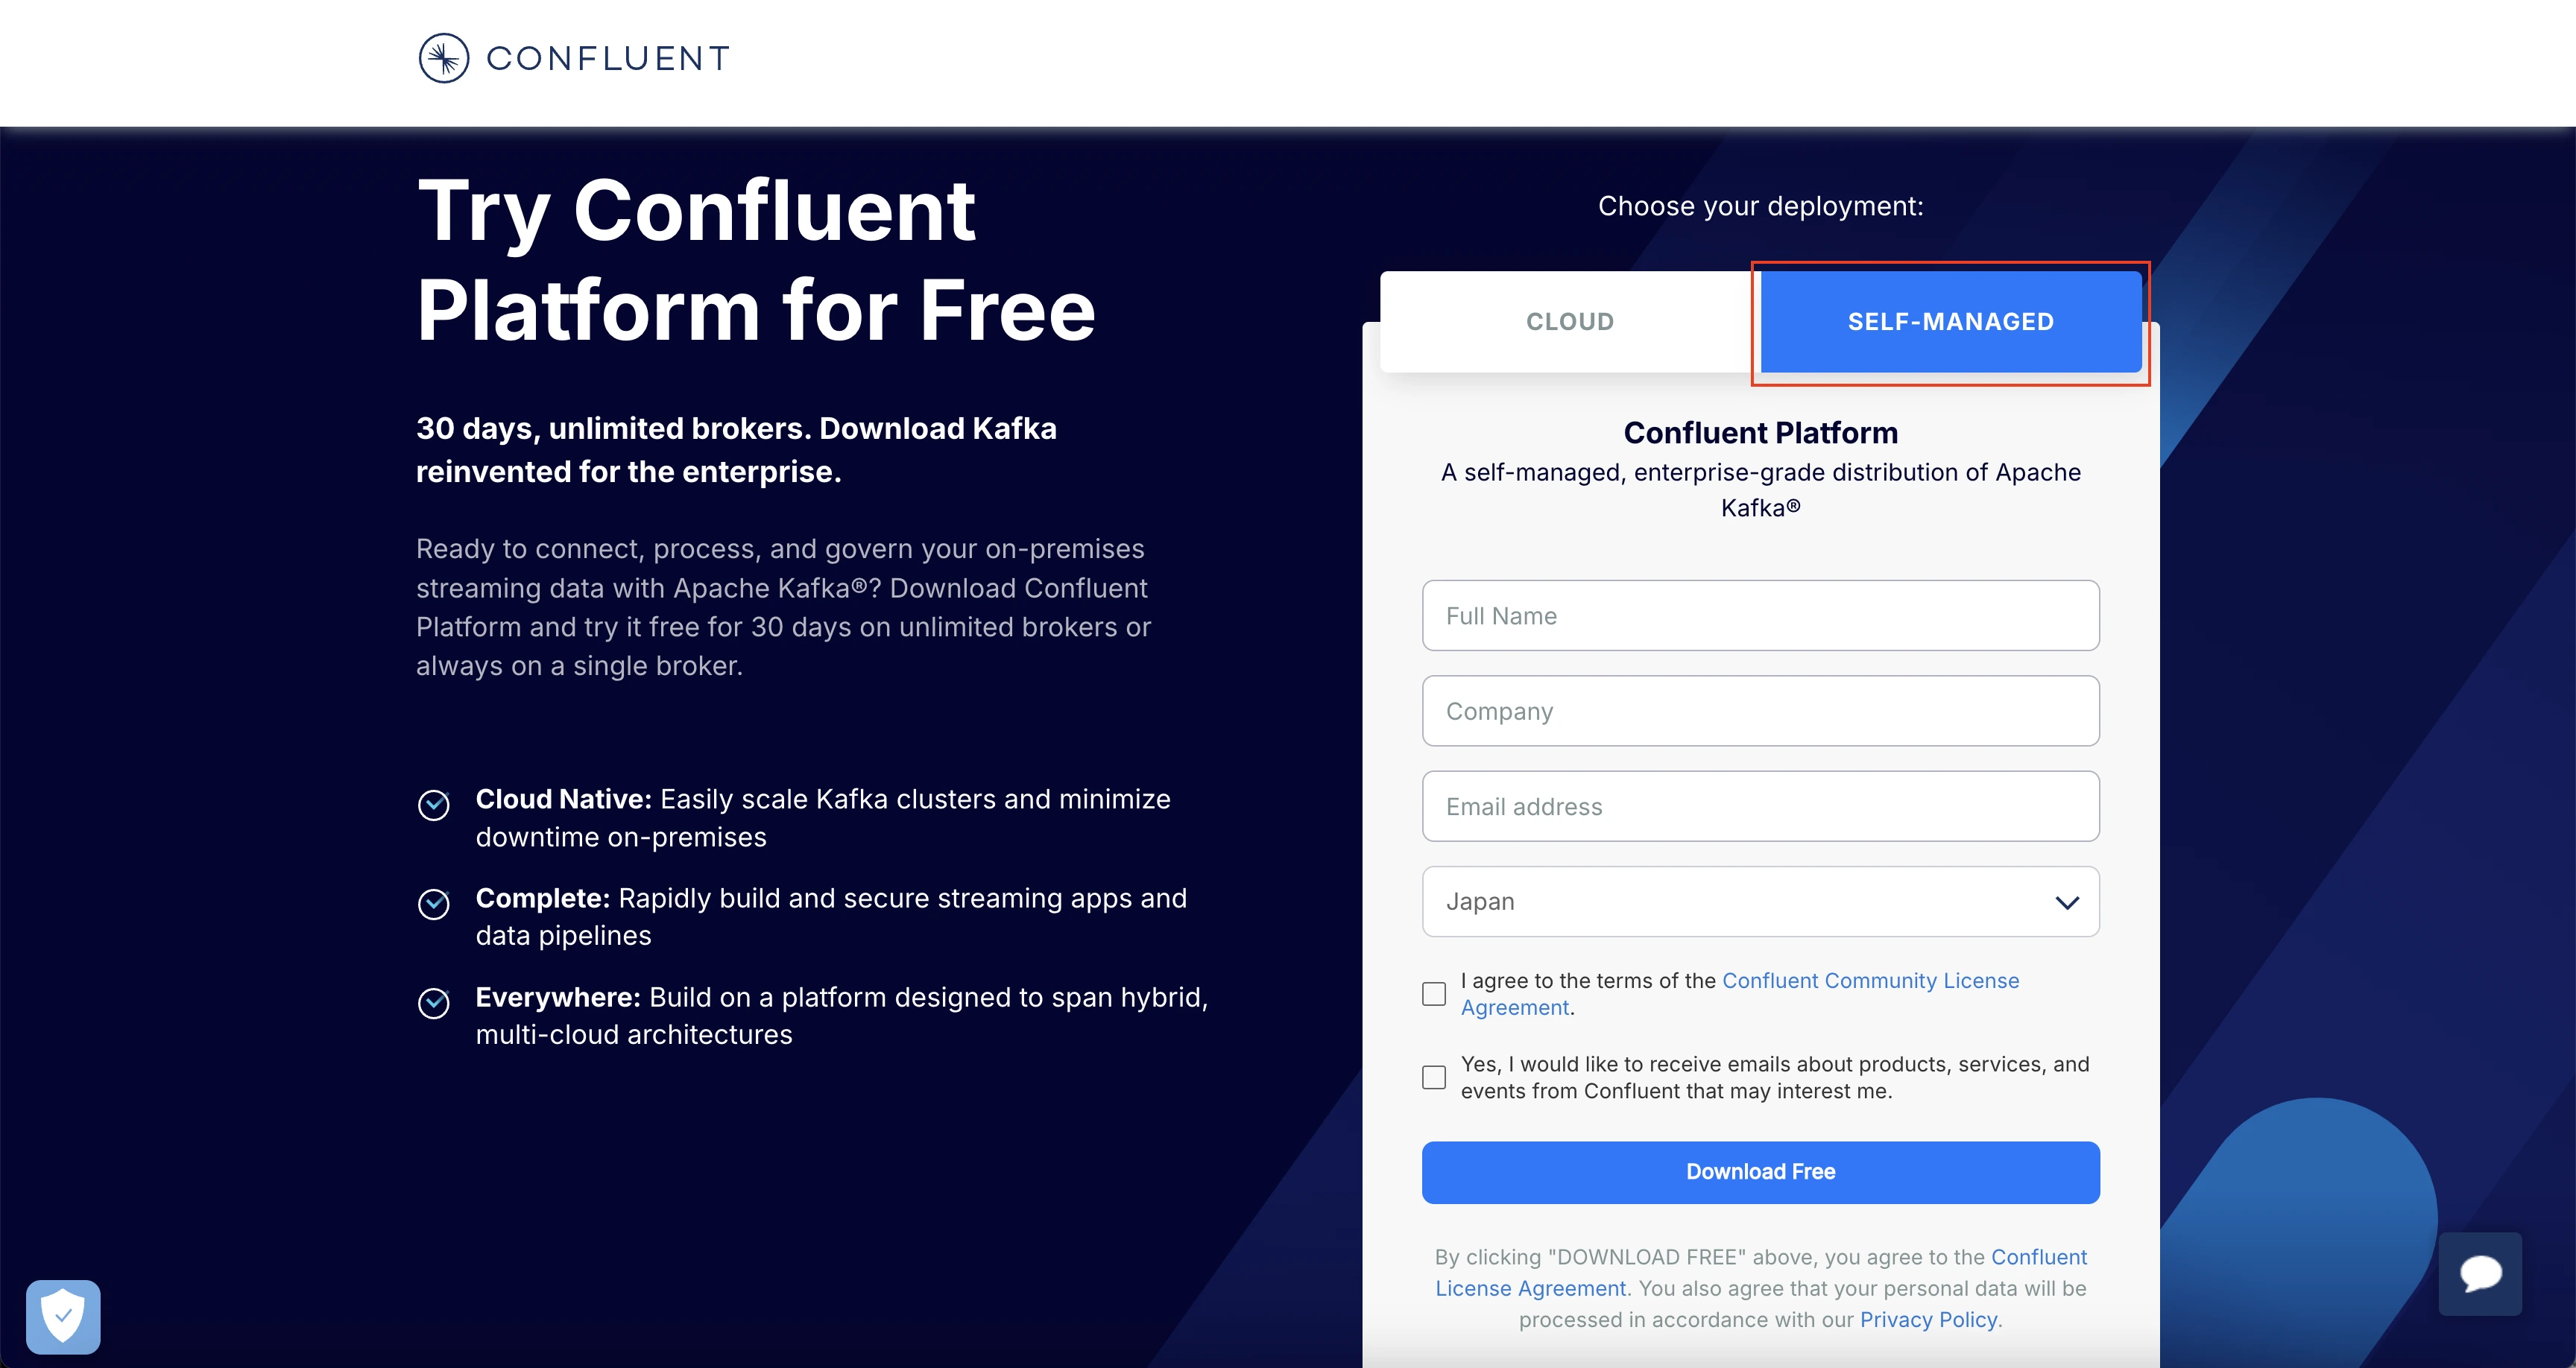
Go to Confluent Get Started page, and select SELF-MANAGED. Fill in the appropriate details, and click on Download Free.

Confluent Self-Managed
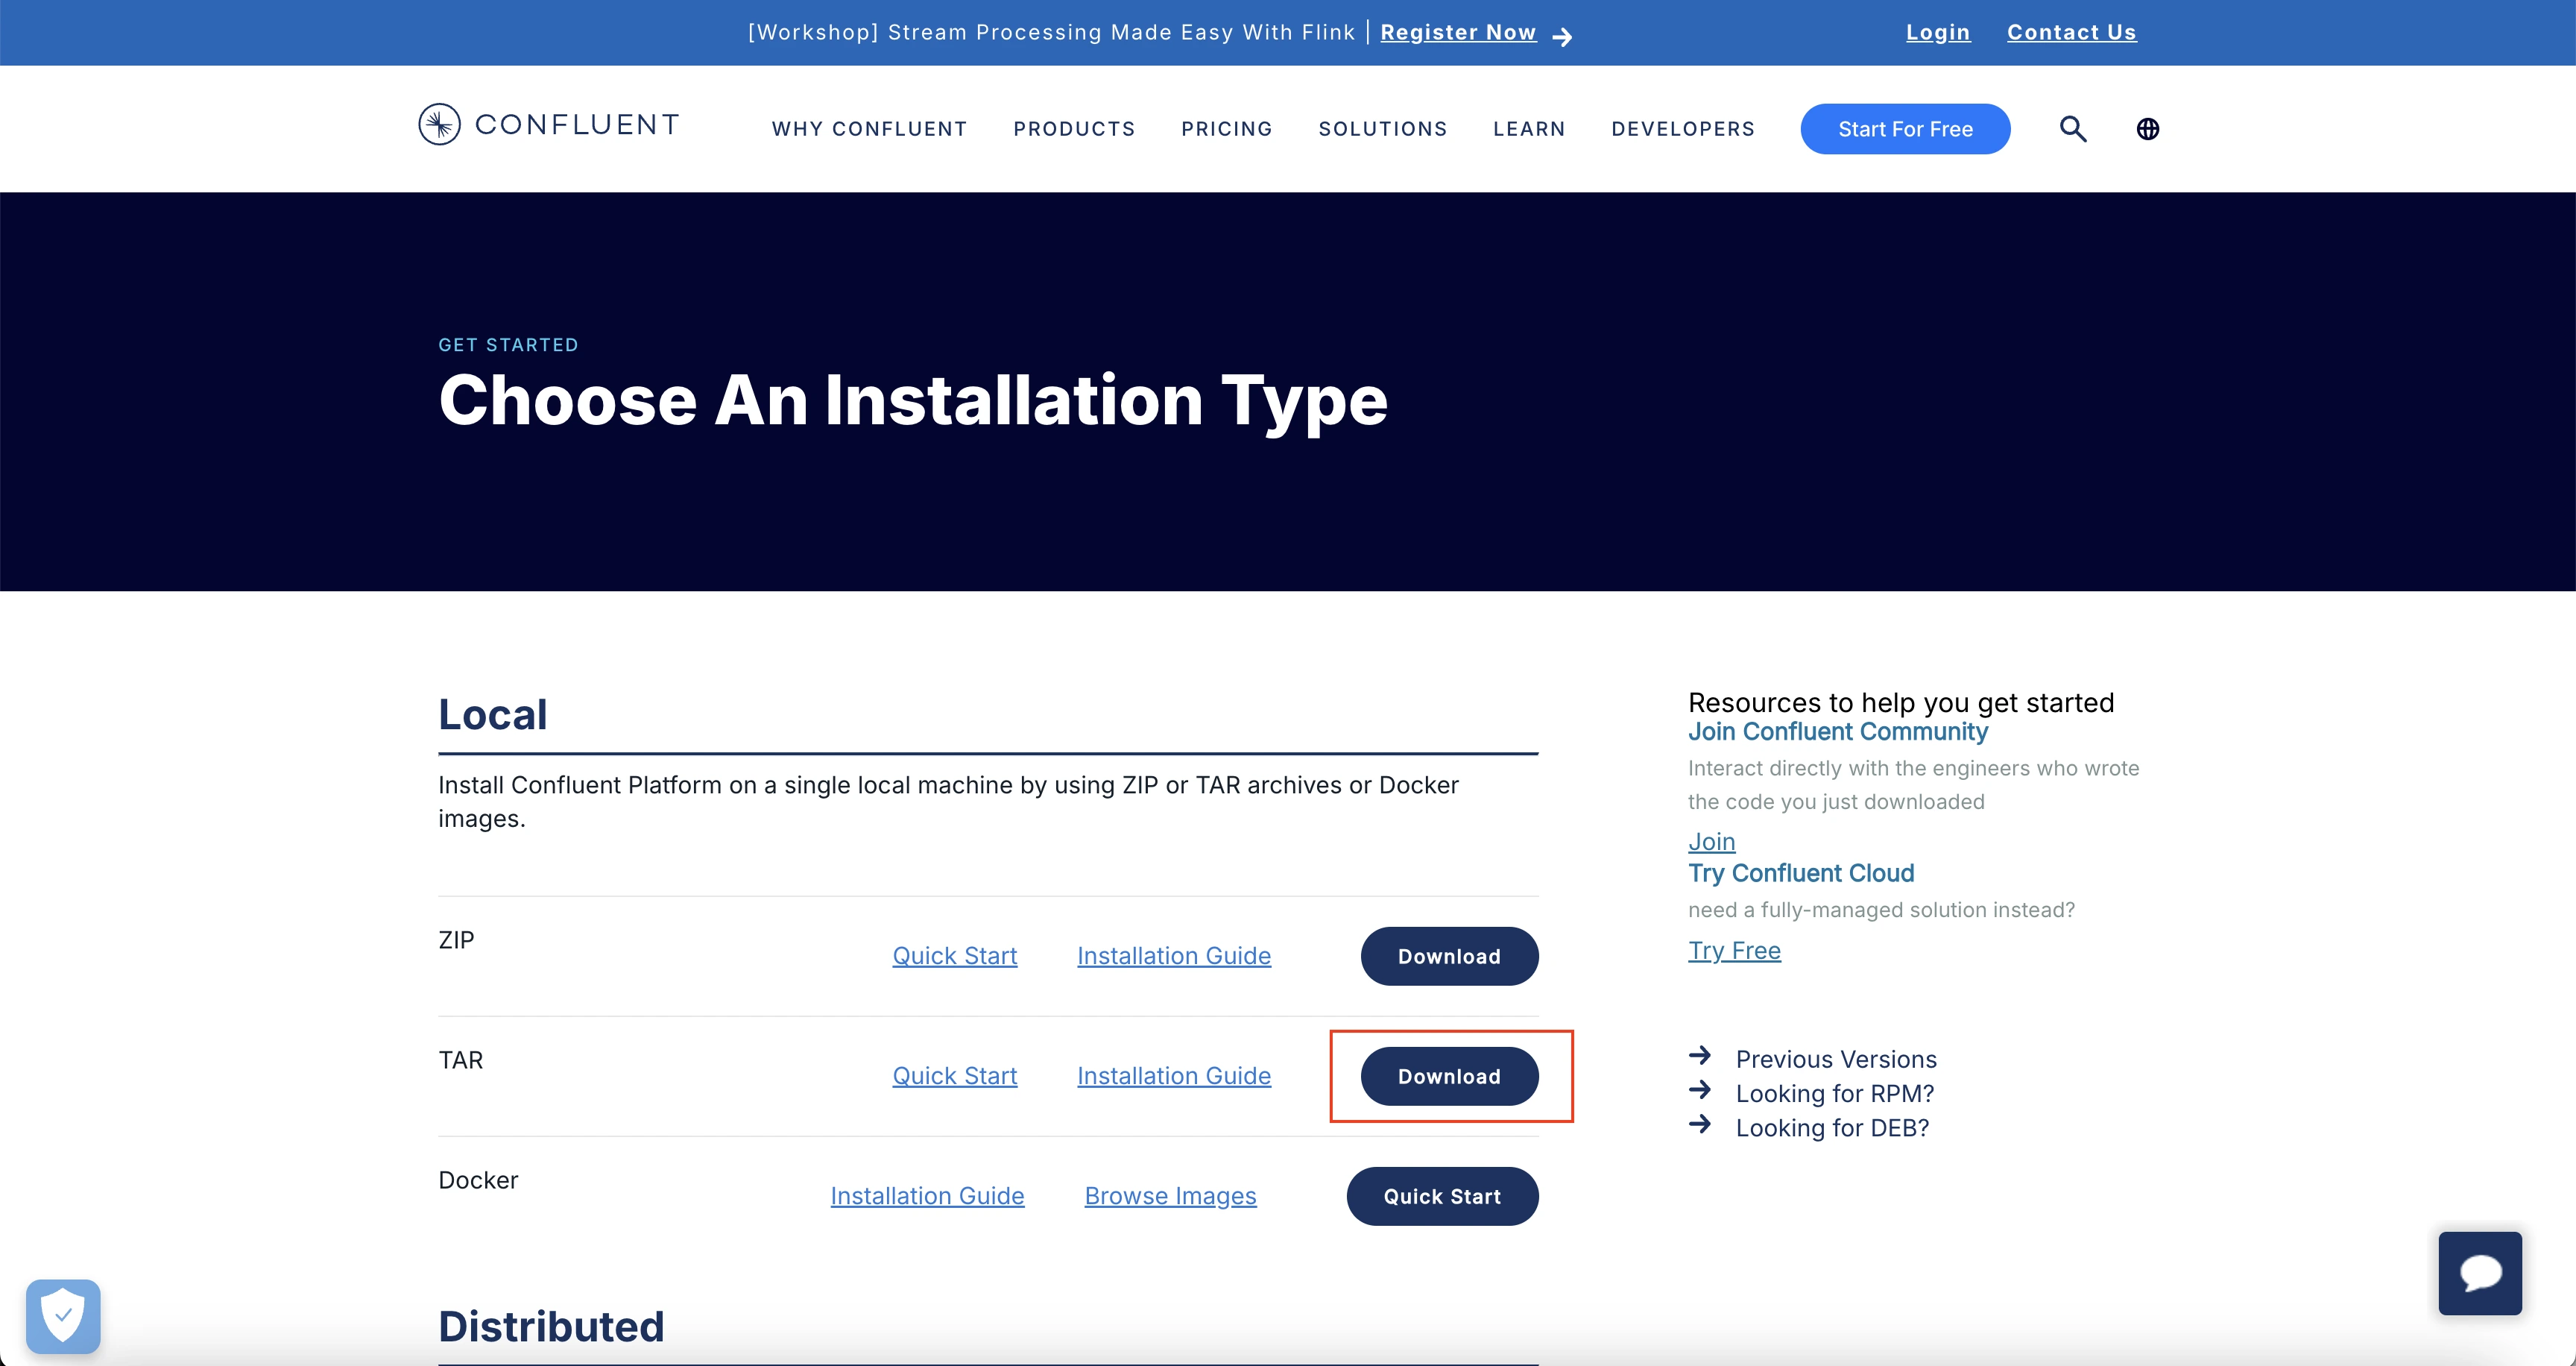
In the Choose An Installation Type page that opens, download the appropraite installation as per your requirement. In this case, we will be downloading tar installation for local machine.

TAR installation download
You can move the downloaded tar file to an appropriate directory if required. Once in the appropriate directory, we will untar the file and cd into the confluent folder.
$ tar -xvzf confluent-7.7.1.tar
$ cd confluent-7.7.1
Replace the version 7.7.1 version in the above commands with the version of the jar that you have downloaded.
1.2 Start Kafka
Kafka can be started using ZooKeeper or KRaft. We will use ZooKeeper:
bin/zookeeper-server-start.sh config/zookeeper.properties
1.3 Configure and Start Brokers
Create two server properties files s1.properties and s2.propertiesto start two brokers:
Make sure you are inside the confluent folder that you extracted in the step before.
# make sure you are inside the extracted kafka folder

cp etc/kafka/server.properties etc/kafka/s1.properties
cp etc/kafka/server.properties etc/kafka/s2.properties
Edit s1.properties:
vi etc/kafka/s1.properties
Add the following configurations:
broker.id=1
listeners=PLAINTEXT://localhost:9092
log.dirs=/tmp/kafka_logs-1
zookeeper.connect=localhost:2181
confluent.metadata.server.listeners=http://localhost:8090
Edit s2.properties:
vi etc/kafka/s2.properties
Add the following configurations:
broker.id=2
listeners=PLAINTEXT://localhost:9093
log.dirs=/tmp/kafka_logs-2
zookeeper.connect=localhost:2181
confluent.metadata.server.listeners=http://localhost:8091
Start Broker 1 with JMX port enabled:
JMX_PORT=2020 bin/kafka-server-start etc/kafka/s1.properties
Start Broker 2 in a new terminal with JMX port enabled:
JMX_PORT=2021 bin/kafka-server-start etc/kafka/s2.properties
1.4 Create Kafka Topics
Create two Kafka topics:
bin/kafka-topics --create --topic topic1 --bootstrap-server localhost:9092 --replication-factor 2 --partitions 1
bin/kafka-topics --create --topic topic2 --bootstrap-server localhost:9092 --replication-factor 2 --partitions 3
1.5 Verify Kafka Setup
List the Kafka topics and their partitions:
bin/kafka-topics --describe --topic topic1 --bootstrap-server localhost:9092
bin/kafka-topics --describe --topic topic2 --bootstrap-server localhost:9092
1.6 Test Kafka Setup
Produce Messages:
bin/kafka-console-producer --topic topic1 --bootstrap-server localhost:9092
Type some messages and press Enter to send.
Consume Messages:
Open a new terminal and run:
bin/kafka-console-consumer --topic topic1 --from-beginning --bootstrap-server localhost:9092
You should see the messages you produced.
Step 2: OpenTelemetry Java Agent Installation
2.1 Java Agent Setup
Install the latest OpenTelemetry Java Agent:
wget https://github.com/open-telemetry/opentelemetry-java-instrumentation/releases/latest/download/opentelemetry-javaagent.jar
2.2 (Optional) Configure OpenTelemetry Java Agent
Refer to the OpenTelemetry Java Agent configurations for advanced setup options.
Step 3: Java Producer-Consumer App Setup
3.1 Running the Producer and Consumer Apps with OpenTelemetry Java Agent
Ensure you have Java and Maven installed.
Compile your Java producer and consumer applications: Ensure your producer and consumer apps are compiled and ready to run.
Run Producer App with Java Agent:
java -javaagent:/path/to/opentelemetry-javaagent.jar \
     -Dotel.service.name=producer-svc \
     -Dotel.traces.exporter=otlp \
     -Dotel.metrics.exporter=otlp \
     -Dotel.logs.exporter=otlp \
     -jar /path/to/your/producer.jar
Run Consumer App with Java Agent:
java -javaagent:/path/to/opentelemetry-javaagent.jar \
     -Dotel.service.name=consumer-svc \
     -Dotel.traces.exporter=otlp \
     -Dotel.metrics.exporter=otlp \
     -Dotel.logs.exporter=otlp \
     -Dotel.instrumentation.kafka.producer-propagation.enabled=true \
     -Dotel.instrumentation.kafka.experimental-span-attributes=true \
     -Dotel.instrumentation.kafka.metric-reporter.enabled=true \
     -jar /path/to/your/consumer.jar
Step 4: OpenTelemetry Collector Setup
Set up the OpenTelemetry Collector to collect JMX metrics from Kafka and spans from producer and consumer clients, then forward them to SigNoz.
4.1 Download the JMX Metrics Collector
Download the JMX metrics collector necessary for Kafka metrics collection.
You can download the latest .jar file for the opentelemetry jmx metrics using this release link.
4.2 Install the OpenTelemetry Collector
Install the local OpenTelemetry Collector Contrib.
Using the Binary:
Download the OpenTelemetry Collector Contrib binary. You can follow this doc to download the binary for your Operating System.
Place the binary in the root of your project directory.
Update config file
Update you collector config with the follwing:
receivers:
  # Read more about kafka metrics receiver - https://github.com/open-telemetry/opentelemetry-collector-contrib/blob/main/receiver/kafkametricsreceiver/README.md
  kafkametrics:
    brokers:
      - localhost:9092
      - localhost:9093
      - localhost:9094
    protocol_version: 2.0.0
    scrapers:
      - brokers
      - topics
      - consumers
  # Read more about jmx receiver - https://github.com/open-telemetry/opentelemetry-collector-contrib/blob/main/receiver/jmxreceiver/README.md
  jmx/1:
    # configure the path where you installed opentelemetry-jmx-metrics jar
    jar_path: path/to/opentelemetry-jmx-metrics.jar #change this to the path to you opentelemetry-jmx-metrics jar file you downloaded above
    endpoint: service:jmx:rmi:///jndi/rmi://localhost:2020/jmxrmi
    target_system: jvm,kafka,kafka-consumer,kafka-producer
    collection_interval: 10s
    log_level: info
    resource_attributes:
      broker.name: broker1
  jmx/2:
    jar_path: ${PWD}/opentelemetry-jmx-metrics.jar
    endpoint: service:jmx:rmi:///jndi/rmi://localhost:2021/jmxrmi
    target_system: jvm,kafka,kafka-consumer,kafka-producer
    collection_interval: 10s
    log_level: info
    resource_attributes:
      broker.name: broker2
exporters:
  otlp:
    endpoint: "ingest.{region}.signoz.cloud:443"
    tls:
      insecure: false
    headers:
      "signoz-ingestion-key": "<SIGNOZ_INGESTION_KEY>"
  debug:
    verbosity: detailed

service:
  pipelines:
    metrics:
      receivers: [kafkametrics, jmx/1, jmx/2]
      exporters: [otlp]
Refer to this SigNoz Cloud Overview page for more details about your {region}.
The config file sets up the OpenTelemetry Collector to gather Kafka and JVM metrics from multiple brokers(2 brokers in the above config) via Kafka metrics scraping and JMX, and exports the telemetry data to SigNoz using the OTLP exporter.
Run the collector
Run the collector with the above configuration :
./otelcol-contrib --config path/to/config.yaml
Step 5: Visualize data in SigNoz
To see the Kafka Metrics:
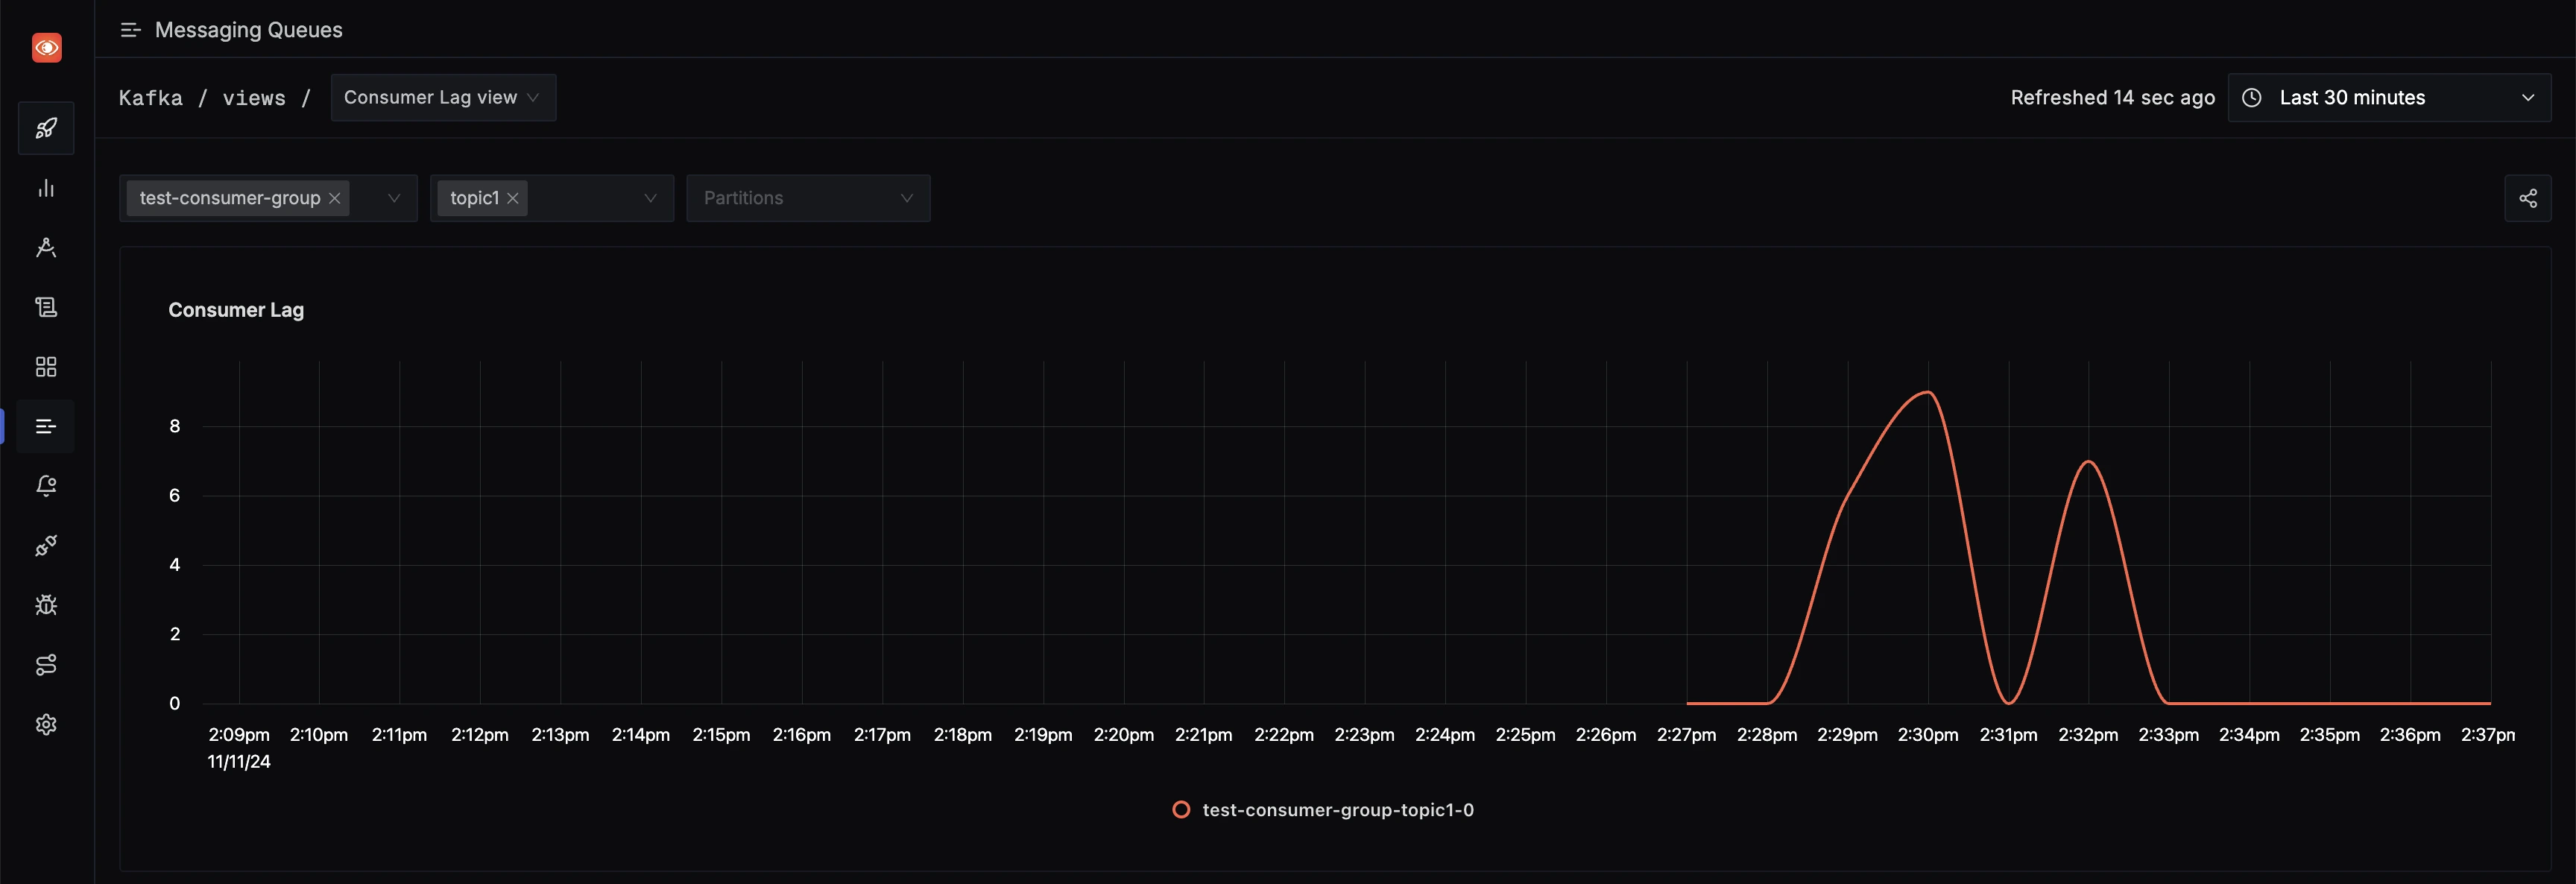
- Head over to Messaging Queues tab in your SigNoz instance.
- You will get different Options like Consumer Lag View etc., to see various kafka related metrics.

Messaging Queues tab in SigNoz
Troubleshooting
If you run into any problems while setting up monitoring for your Confluent Platform metrics with SigNoz, consider these troubleshooting steps:
- Verify Confluent Platform Setup: Double-check that you have followed the steps for setting up Kafka Cluster as shown above.
- Verify Configuration: Double-check your
config.yamlfile to ensure all settings, including the ingestion key and endpoint, are correct. - Review Logs: Look at the logs of the OpenTelemetry Collector to identify any error messages or warnings that might provide insights into what’s going wrong.
- Consult Documentation: Review the SigNoz and OpenTelemetry documentation for any additional troubleshooting of the common issues.
